
MOVE Tool

Our interactive map helps you find out what regional town or city is the best fit for you

We all know that median house prices vary enormously across Australia – from well over $1 million in our capital cities to under $50,000 in isolated small towns. We also know that average incomes vary. So, the key to worry-free home ownership is hitting the sweet spot with these two ingredients – places with good average incomes and low median house prices. Our MOVE tool shows just that. 

We have developed an interactive map which helps you find out if a regional town or city is a better fit for you both financially, and to an extent, in lifestyle as well.

How Does it Work?

Hover over a region on the map to see the name and a pop-up of information about that LGA, including:

  • the place type;
  • median house price (as at 31/01/2019);
  • average income (for 2018-19);
  • the average number of years to pay off a house mortgage, if 28% of income is put toward mortgage repayments;
  • unemployment rate;
  • average distance to a National Park (km);
  • average distance to the coast (km); and
  • its diversification score.

More information about these measures is below.

If you click on a region on the map, you can see the liveability data for it in the bar graphs to the right of the map. To add another region to compare with one currently selected, hold CTRL and click on another region.

If you want to zoom in on an area, hover over it with your mouse and use the scroll wheel to zoom in. Alternatively, you can use the ‘+’ and ‘-‘ buttons in the tool box on the left side of the map.

You can also search for a LGA by clicking the search icon at the top-left, typing in the name, and selecting a place from the list.

Enjoy exploring the MOVE tool and finding a regional area that’s right for you!

Definition of The Measures

Diversification index

To measure how economically-diverse a region is, we use the Hachman index of economic diversification. It shows how diverse a region’s economic structure is relative to that of the Australian economy.

Values closer to one mean that the region’s economic structure is very diverse. Values closer to zero mean that the region is dominated by just one or two industries.

As an example, Albury in NSW has one of the most diverse economies found in a Local government area with a diversification index of 0.93. This is due to employment spread out over a range of industries. At the other end of the spectrum is East Pilbara (index of 0.04), where mining is the dominant industry. To illustrate this, the graph below shows the spread of workers across many industries in Albury and East Pilbara.

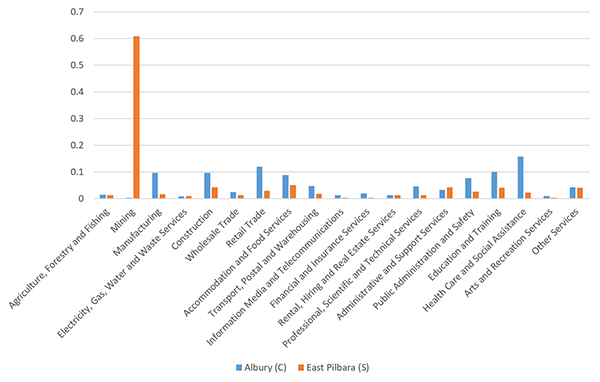
Figure 1: Diversification – the two extremes

Number of years

This measure is the number of years it would take, with a typical income, to pay off a median-priced house in that specific LGA.

To obtain this number, the median house price of an LGA is divided by 28% of the average income for the same region. 28% is a threshold typically used by banks as a maximum amount of income that should be committed to a mortgage. Our calculations do not include any interest.

National Park index

This is a simple measure to show the proximity of National Parks to where people live in a region. In the graph to the right of the map, it is represented as an index. A rating closer to one shows closer (better) proximity – the value in kilometres is also available in the popup information on the map.

Coastal index

This is a similar measure that shows the proximity of the coast to where people live in a region. In the graph to the right of the map, it is also represented as an index. A rating closer to one shows closer (better) proximity – the value in kilometres is also available in the popup information on the map.

About the Four Place Types

Our analysis of house price and income ratios around Australia show four main types of places: specialised, high end, appreciating, and low cost. For more information on this analysis, read our blog Unpacking Housing Affordability in Regional Australia.