The Regional Australia Institute (RAI) provides a monthly snapshot of the regional labour market, offering insights into key indicators for job vacancies, labour force size, participation rate, employed population and unemployment rate. The analysis captures current labour market dynamics and recent historical trends to provide a comprehensive perspective for regional Australia.
Regional Australia is defined as all parts of Australia outside the five metropolitan cities with populations exceeding one million people-Sydney, Melbourne, Brisbane, Adelaide and Perth. The report uses datasets from the Australian Bureau of Statistics (ABS) and Jobs and Skills Australia (JSA).
Regional labour market data for May 2026 shows a stronger month for regional employment and labour force participation, alongside a fall in the unemployment rate - the regional unemployment rate of 3.8 per cent is significantly below the metropolitan unemployment rate of 4.6 per cent. Regional job vacancies softened slightly over the month but remain above levels recorded a year earlier. Taken together, the data points to a regional labour market that remains tight, despite short-term monthly fluctuations in both labour supply and employer demand.
Regional Job Vacancies
Regional job vacancies advertised online reached 69,084 in May 2026, recording a 0.9% decrease from April. Despite the monthly decline, vacancies remained higher than the same period last year, increasing by 2.1% year-on-year. Metropolitan areas also recorded a monthly decrease of 1.0%, but unlike regional areas, vacancies were down 1.9% annually.
Regional Australia Job Vacancies
Source: Jobs and Skills Australia, monthly internet vacancies, RAI
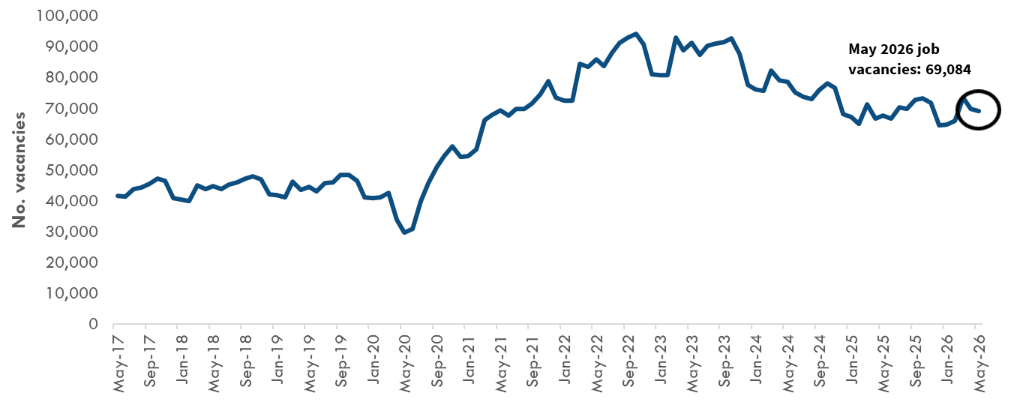
All states and territories recorded monthly declines in regional job vacancies in May. Most states recorded annual growth, although vacancies declined over the year in Regional VIC, ACT and Northern Territory.
| Number
of job vacancies advertised online |
May-26 |
% change (monthly) |
% change (annual) |
| Regional Australia |
69,084 |
-0.9% |
2.1% |
| Regional NSW |
20,212 |
-0.2% |
8.4% |
| Regional VIC |
9,157 |
-0.7% |
-0.4% |
| Regional QLD |
21,946 |
-1.6% |
0.8% |
| Regional SA |
2,092 |
-0.3% |
17.8% |
| TAS |
3,169 |
-0.5% |
2.0% |
| Regional WA |
5,061 |
-1.8% |
0.1% |
| NT |
2,920 |
-0.9% |
-3.0% |
| ACT |
4,528 |
-1.0% |
-11.5% |
| Mainland Capital Cities |
135,911 |
-1.0% |
-1.9% |
The regions with the highest monthly increases in job vacancies were:
- Tamworth and North West NSW (8.3%)
- Yorke Peninsula & Clare Valley (8.3%)
- Southern Highlands & Snowy (5.0%)
The top three occupational categories for regional job vacancies were Professionals (29%), Technicians and Trades Workers (15%) and Clerical and Administrative Workers (12%). At a more detailed level, the three most in-demand regional occupations were Medical Practitioners and Nurses (6,809), Carers and Aides (4,832) and General-Inquiry Clerks, Call Centre Workers, and Receptionists (4,558).
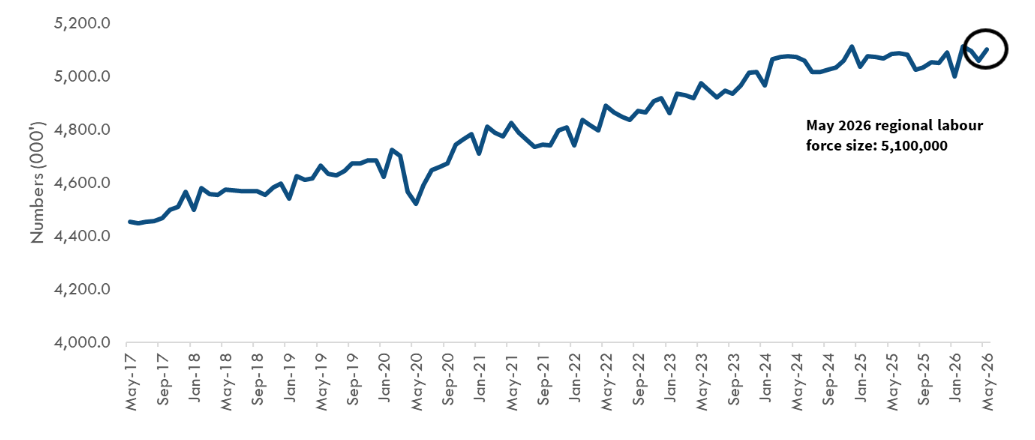
Regional Labour Force
In May, the regional labour force increased to 5,100,000, up 0.8% from April. Compared with May 2025, the regional labour force was broadly unchanged, while the longer-term trend continues to point to an expanded regional labour market relative to pre-pandemic levels and in line with population growth.
Regional Australia labour force size
Source: ABS Labour Force (detailed), RAI
The table below presents the regional labour force size by state and territory. Queensland has both the largest regional labour force, at 1,526.8 thousand people, and the largest regional labour force share among the five mainland states, at 47.8% of the state’s total labour force. Western Australia has proportionally the smallest regional labour force at 18.0%. For Tasmania, the Northern Territory and the Australian Capital Territory, the entire jurisdiction is classified as regional Australia.
| State/Territory |
Regional Labour Force Size ('000) |
Percentage of total labour force (%) |
| NSW |
1,489.1 |
31.3 |
| Vic. |
821.8 |
20.5 |
| Qld |
1,526.8 |
47.8 |
| SA |
198.3 |
19.2 |
| WA |
317.4 |
18 |
| Tas. |
297.0 |
100 |
| NT |
158.0 |
100 |
| ACT |
291.2 |
100 |
| Australia |
5,099.7 |
32.9 |
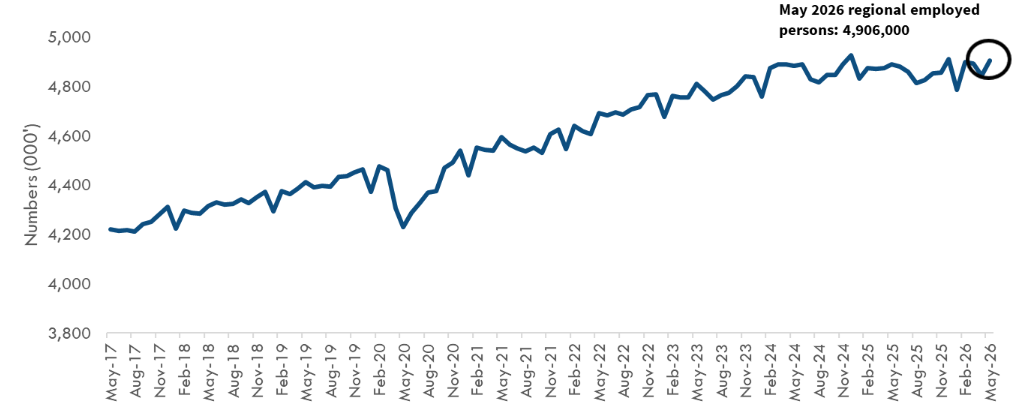
Regional Employed Persons
The number of employed people in regional Australia rose to 4,906,000 in May, representing a 1.3% increase from April. Employment remains close to recent highs, although the latest result points to a stronger monthly outcome.
Regional Australia employed people
Source: ABS Labour Force (detailed), RAI
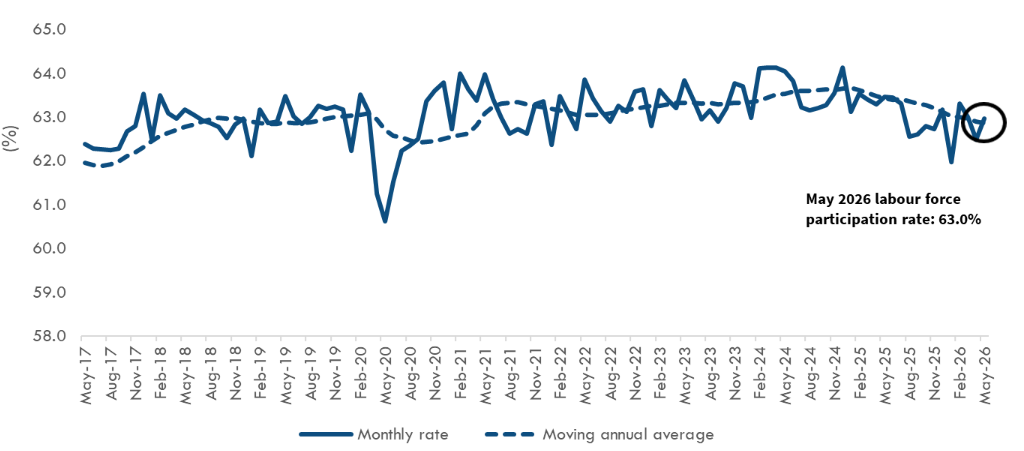
Regional Australia Participation Rate
The regional labour force participation rate stood at 63.0% in May 2026, up from 62.5% in April. After smoothing out seasonal fluctuations, the annual moving average has eased through recent months, suggesting a weakening in labour force engagement across regional Australia.
Regional Australia Participation Rate
Source: ABS Labour Force (detailed) RAI
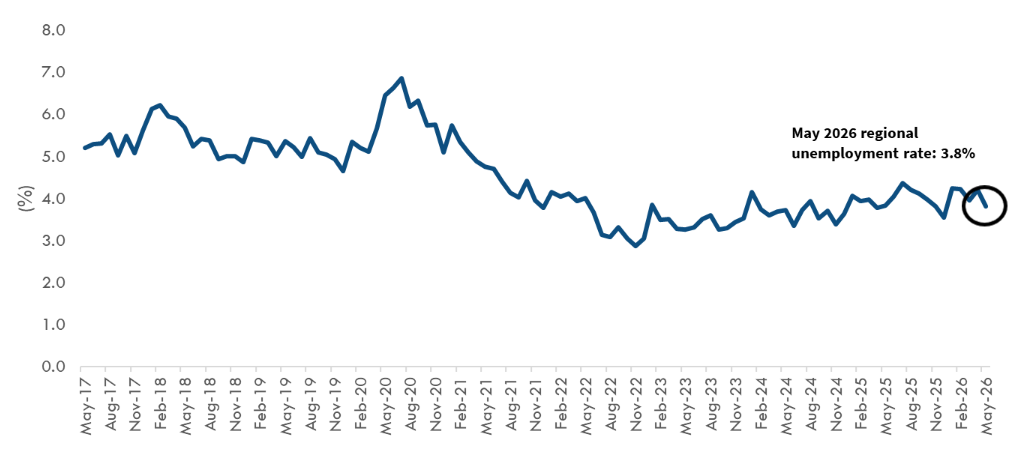
Regional Australia Unemployment Rate
The regional unemployment rate fell to 3.8% in May, down 0.4 percentage points from April. This remained below the metropolitan unemployment rate of 4.6%, which also eased over the month. Unemployment remains low by historical standards, indicating that regional labour markets continue to operate with limited spare capacity.
Regional Australia Unemployment Rate
Source: ABS Labour Force (detailed) RAI