
Regional Labour Markets Update – June 2025

31 July 2025

Using datasets from the Australian Bureau of Statistics (ABS) and Jobs and Skills Australia (JSA), the Regional Australia Institute (RAI) provides a monthly snapshot of the regional labour market, offering insights into key indicators for job vacancies, labour force size, participation rate, employed population and unemployment rate.¹ This analysis not only captures current labour market dynamics but also examines historical trends to provide a comprehensive perspective for regional Australia.

For this report, regional Australia is defined as all parts of Australia outside the five metropolitan cities with populations exceeding one million people, Sydney, Melbourne, Brisbane, Adelaide and Perth. 

Regional Job Vacancies

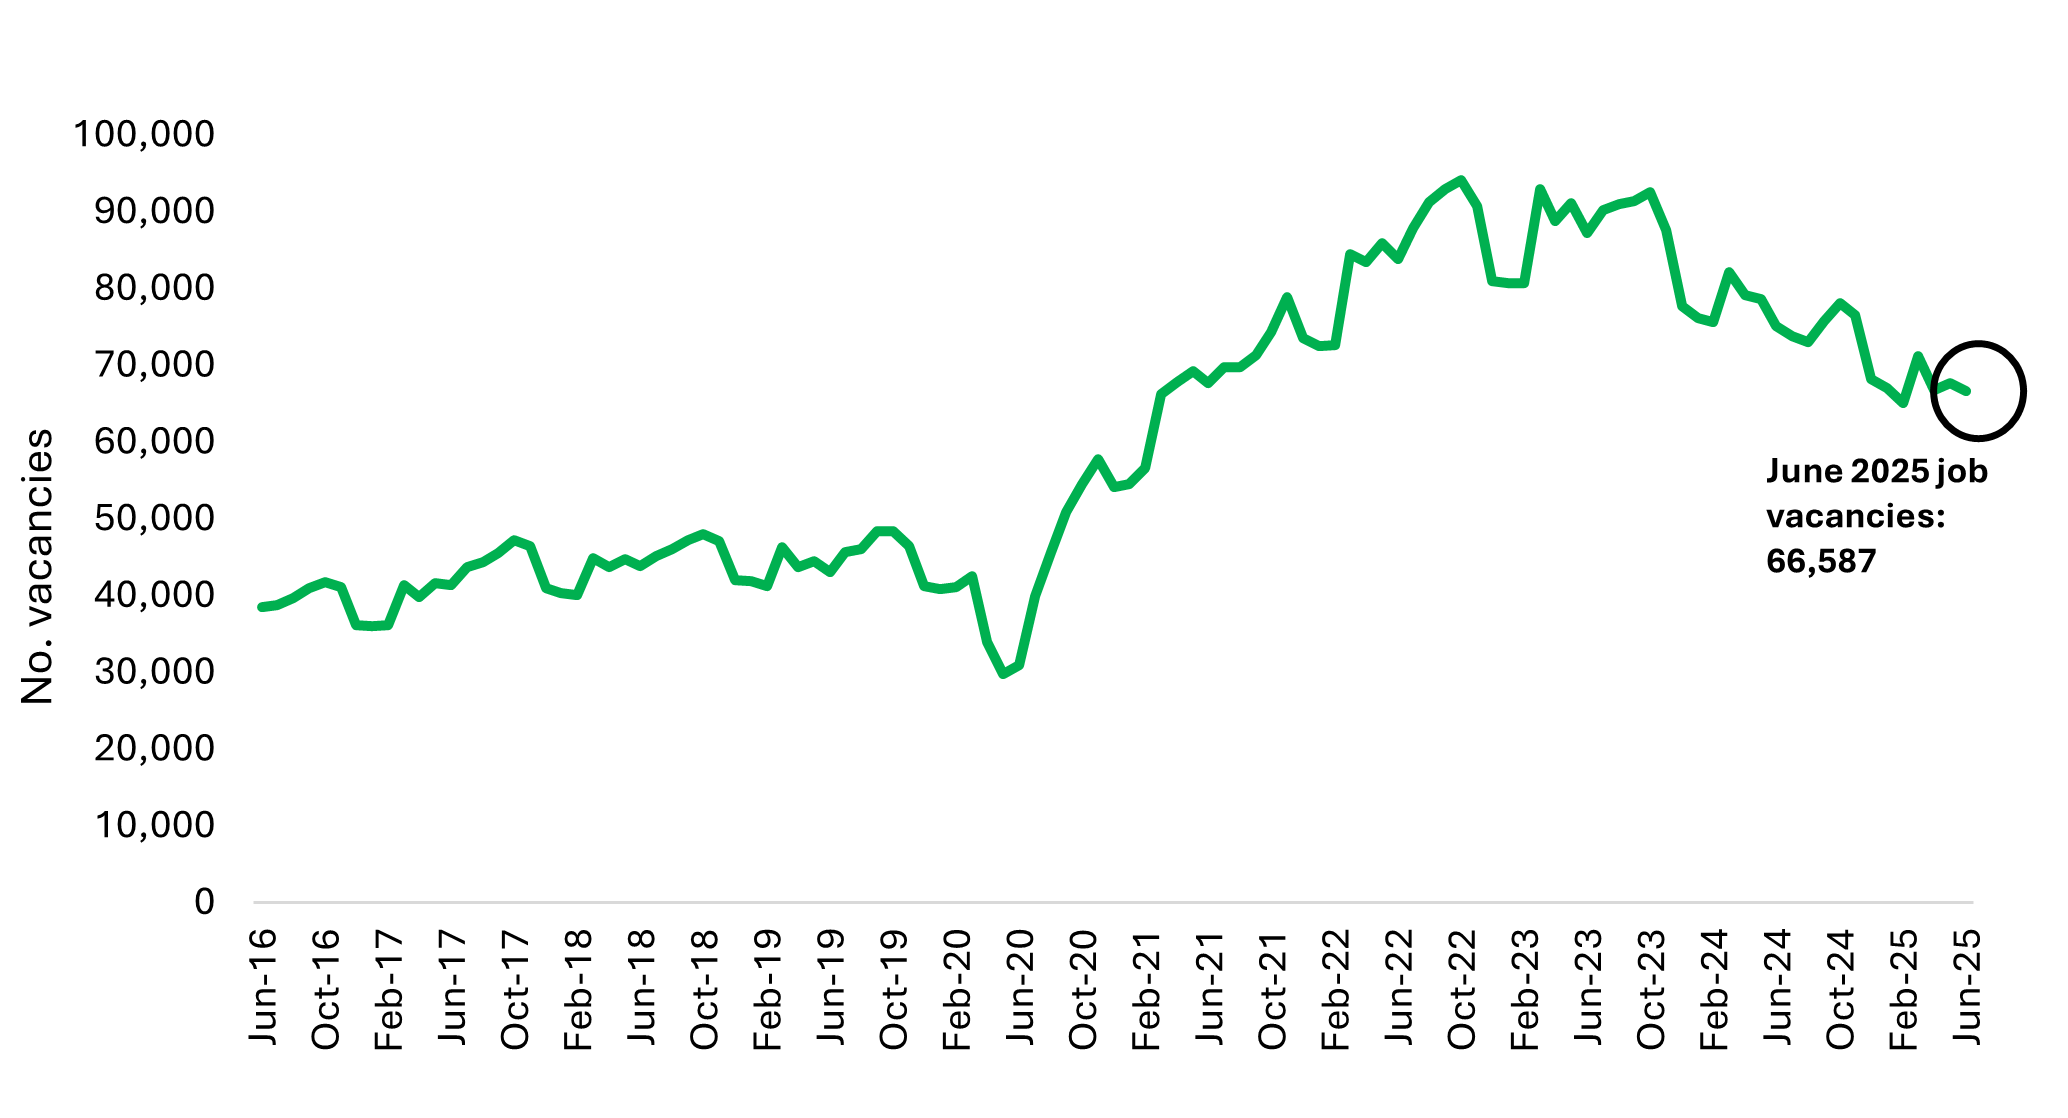
In June 2025, regional Australia recorded 66,587 online job advertisements - a 1.6% decrease from the previous month and an 11.3% drop compared to the same period last year. 

While most regions experienced a monthly decline, a few bucked the trend: Tamworth and North West NSW rose by 6.1%, followed by the Gold Coast (2.6%), Sunshine Coast (2.5%), NSW North Coast (1.8%), Port Augusta & Eyre Peninsula (1.4%), and Dubbo & Western NSW (0.5%).

The top three occupational categories for job vacancies were Professionals (27%), Technicians and Trade Workers (16%) and Clerical and Administrative Workers (13%).

Regional Australia Job Vacancies

Source: Jobs and Skills Australia, monthly internet vacancies, RAI
Regional Labour Force Size and Employed People

Despite job ads easing, the regional labour force remained stable at 5.06 million in June, highlighting strong ongoing population growth and workforce participation in the regional economy. 

Regional Australia labour force size

Source: ABS Labour Force (detailed), RAI
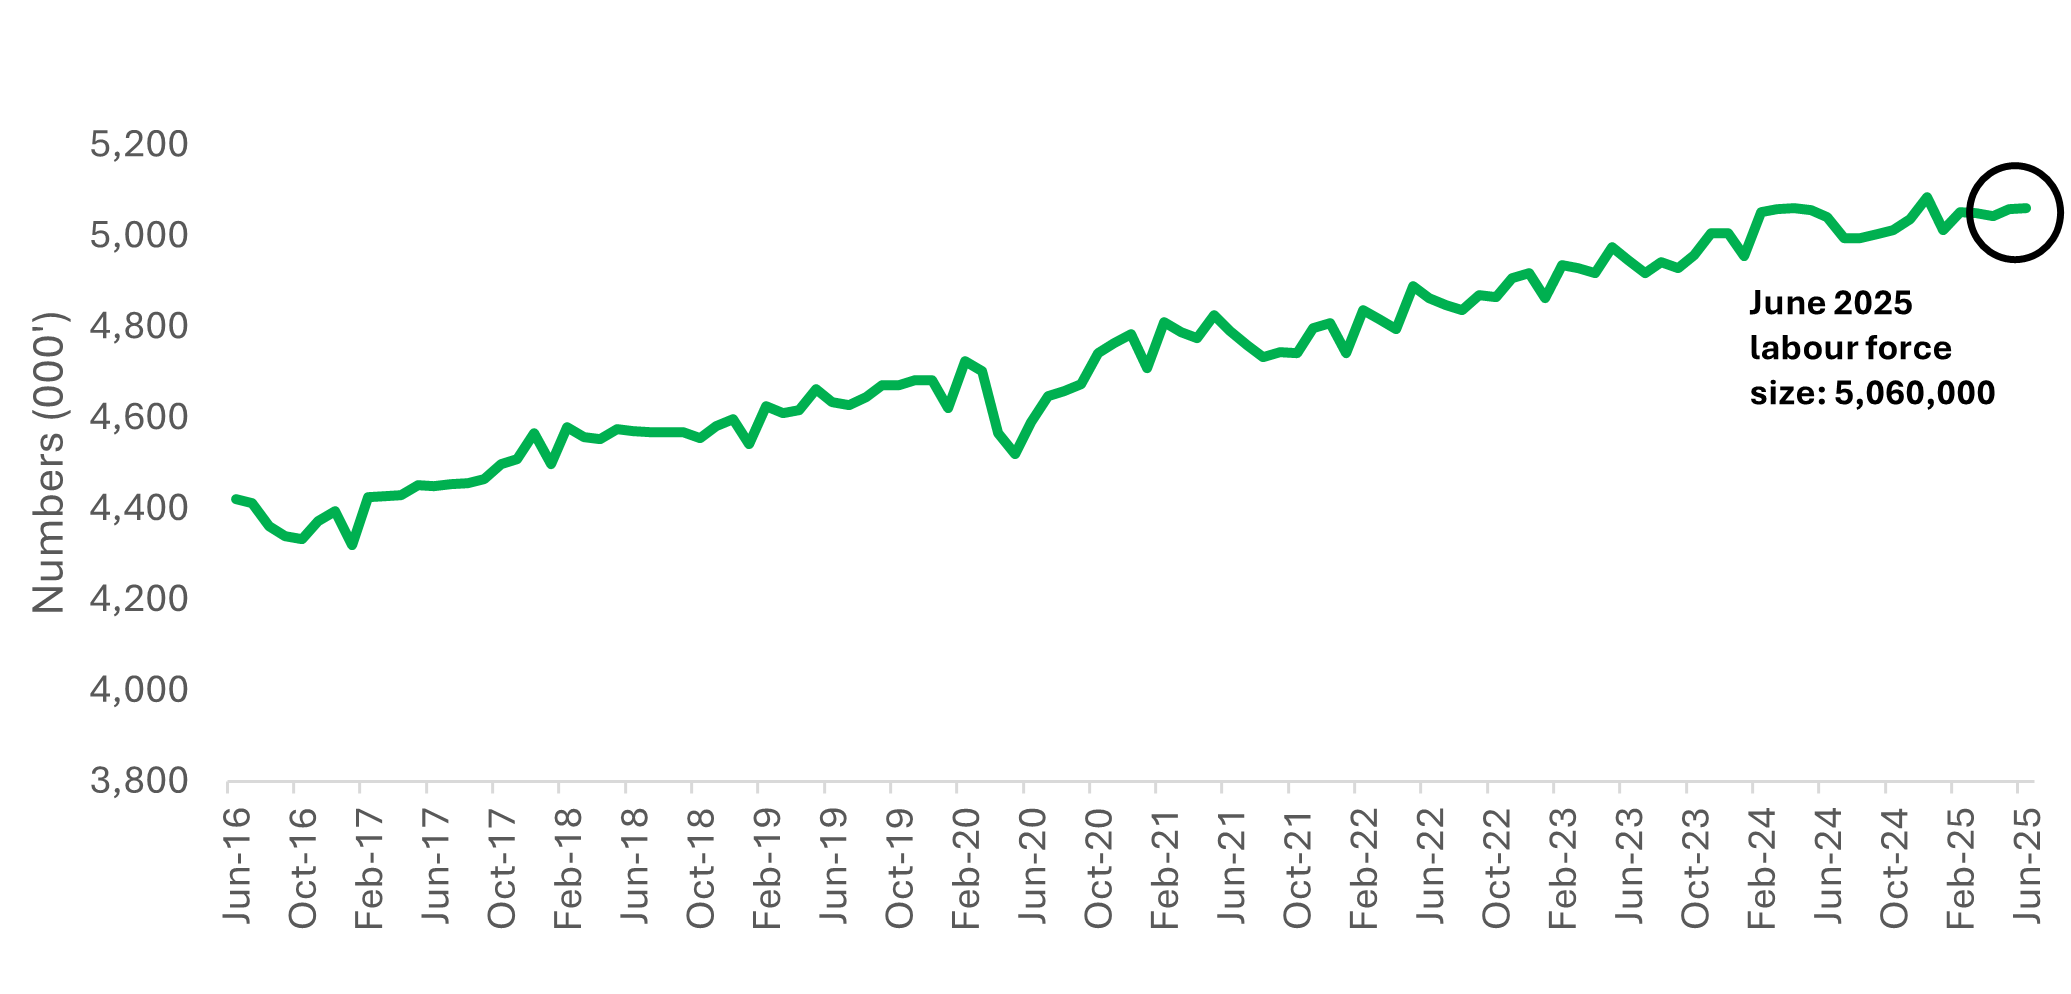
The table below presents the regional labour force size by state and territory and its share of total. Queensland has the largest regional labour force with 1,525,900 people, making up nearly 50% of the state’s total labour force. For Tasmania, the Northern Territory and the Australian Capital Territory, the entire jurisdiction is classified as regional Australia.

State/Territory Regional Labour Force Size ('000) Percentage of state/territory labour force (%)
NSW 1,471.5  31.4
Vic. 812.9  20.4
Qld. 1525.9  48.4
SA 206.4 20.2
WA 314.1 18.3
Tas. 295.1 100.0
NT 149.5 100
ACT 284.9 100.0
Australia 5,060 33.1

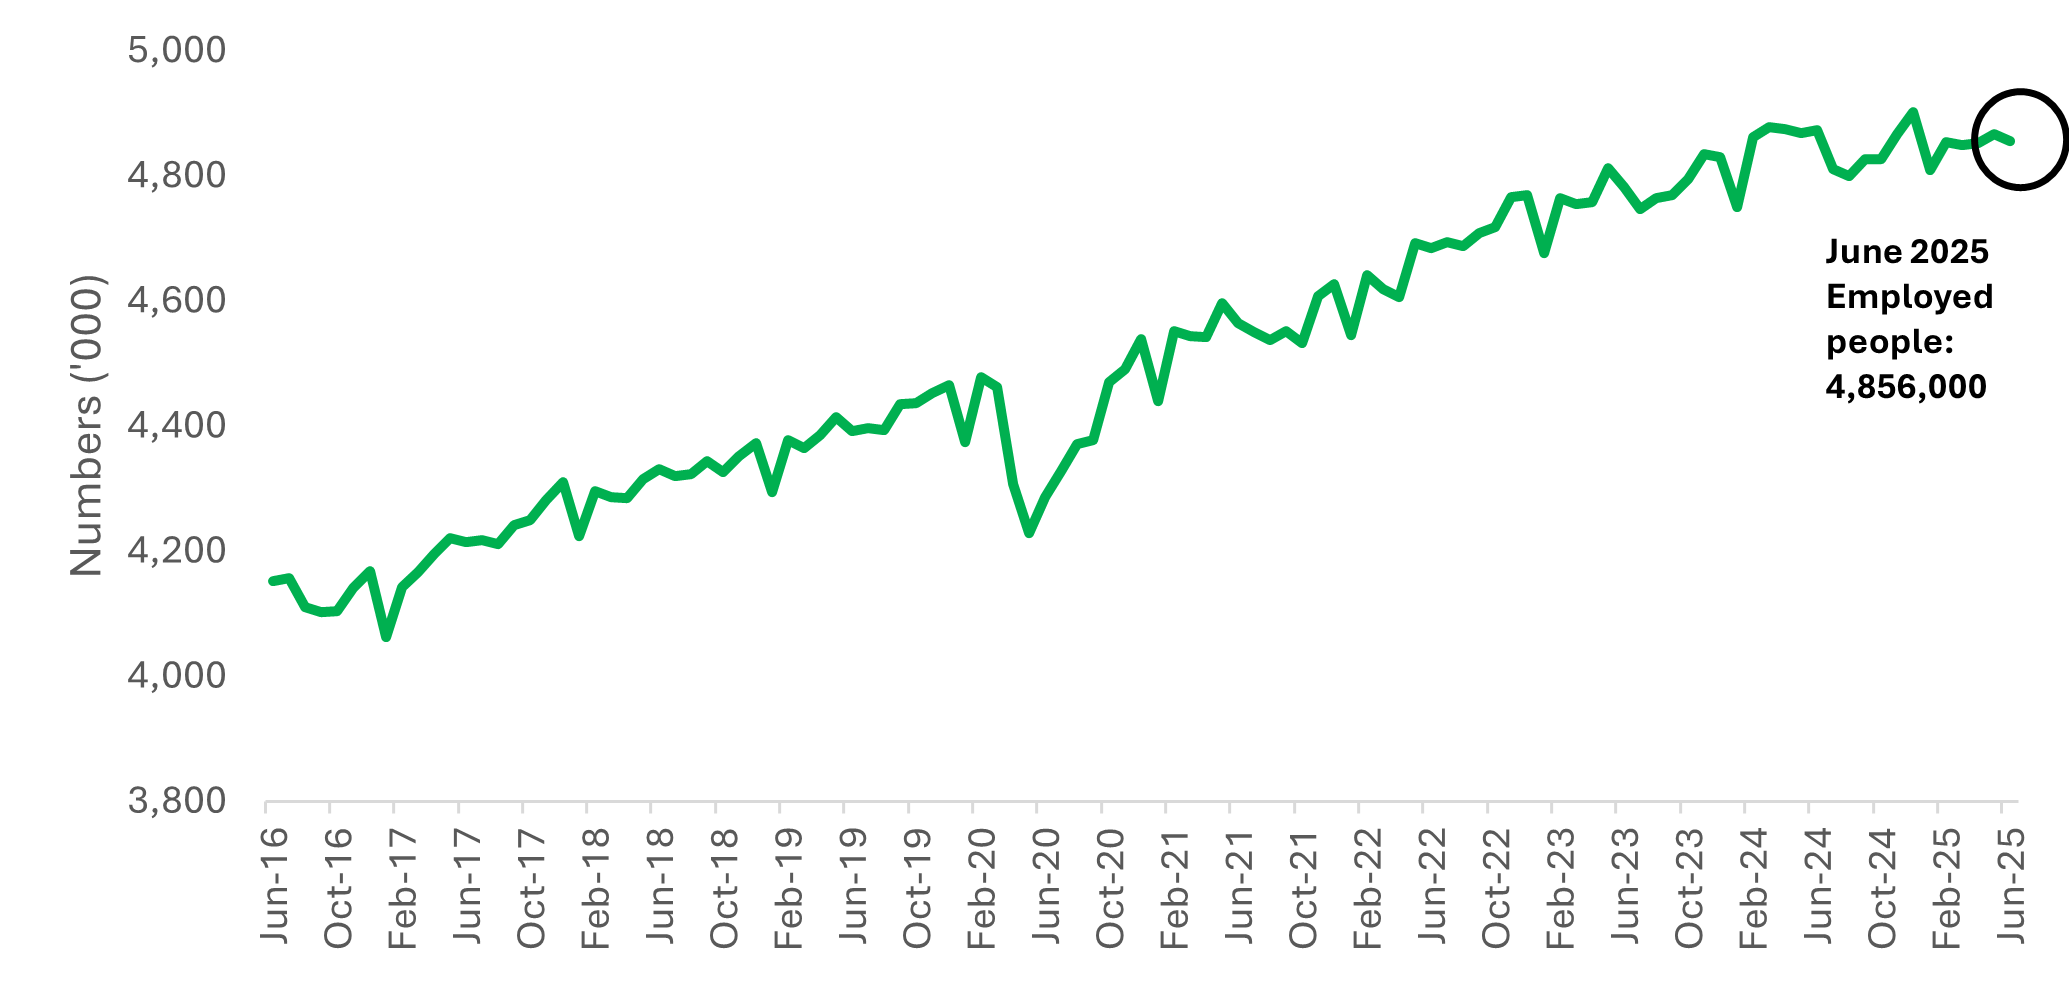
Employment in regional Australia reached 4,856,000 in June – a minimal 0.2% decrease from May and was largely unchanged compared to last year. 

Regional Australia employed people

Source: ABS Labour Force (detailed), RAI 
Regional Australia Participation Rate

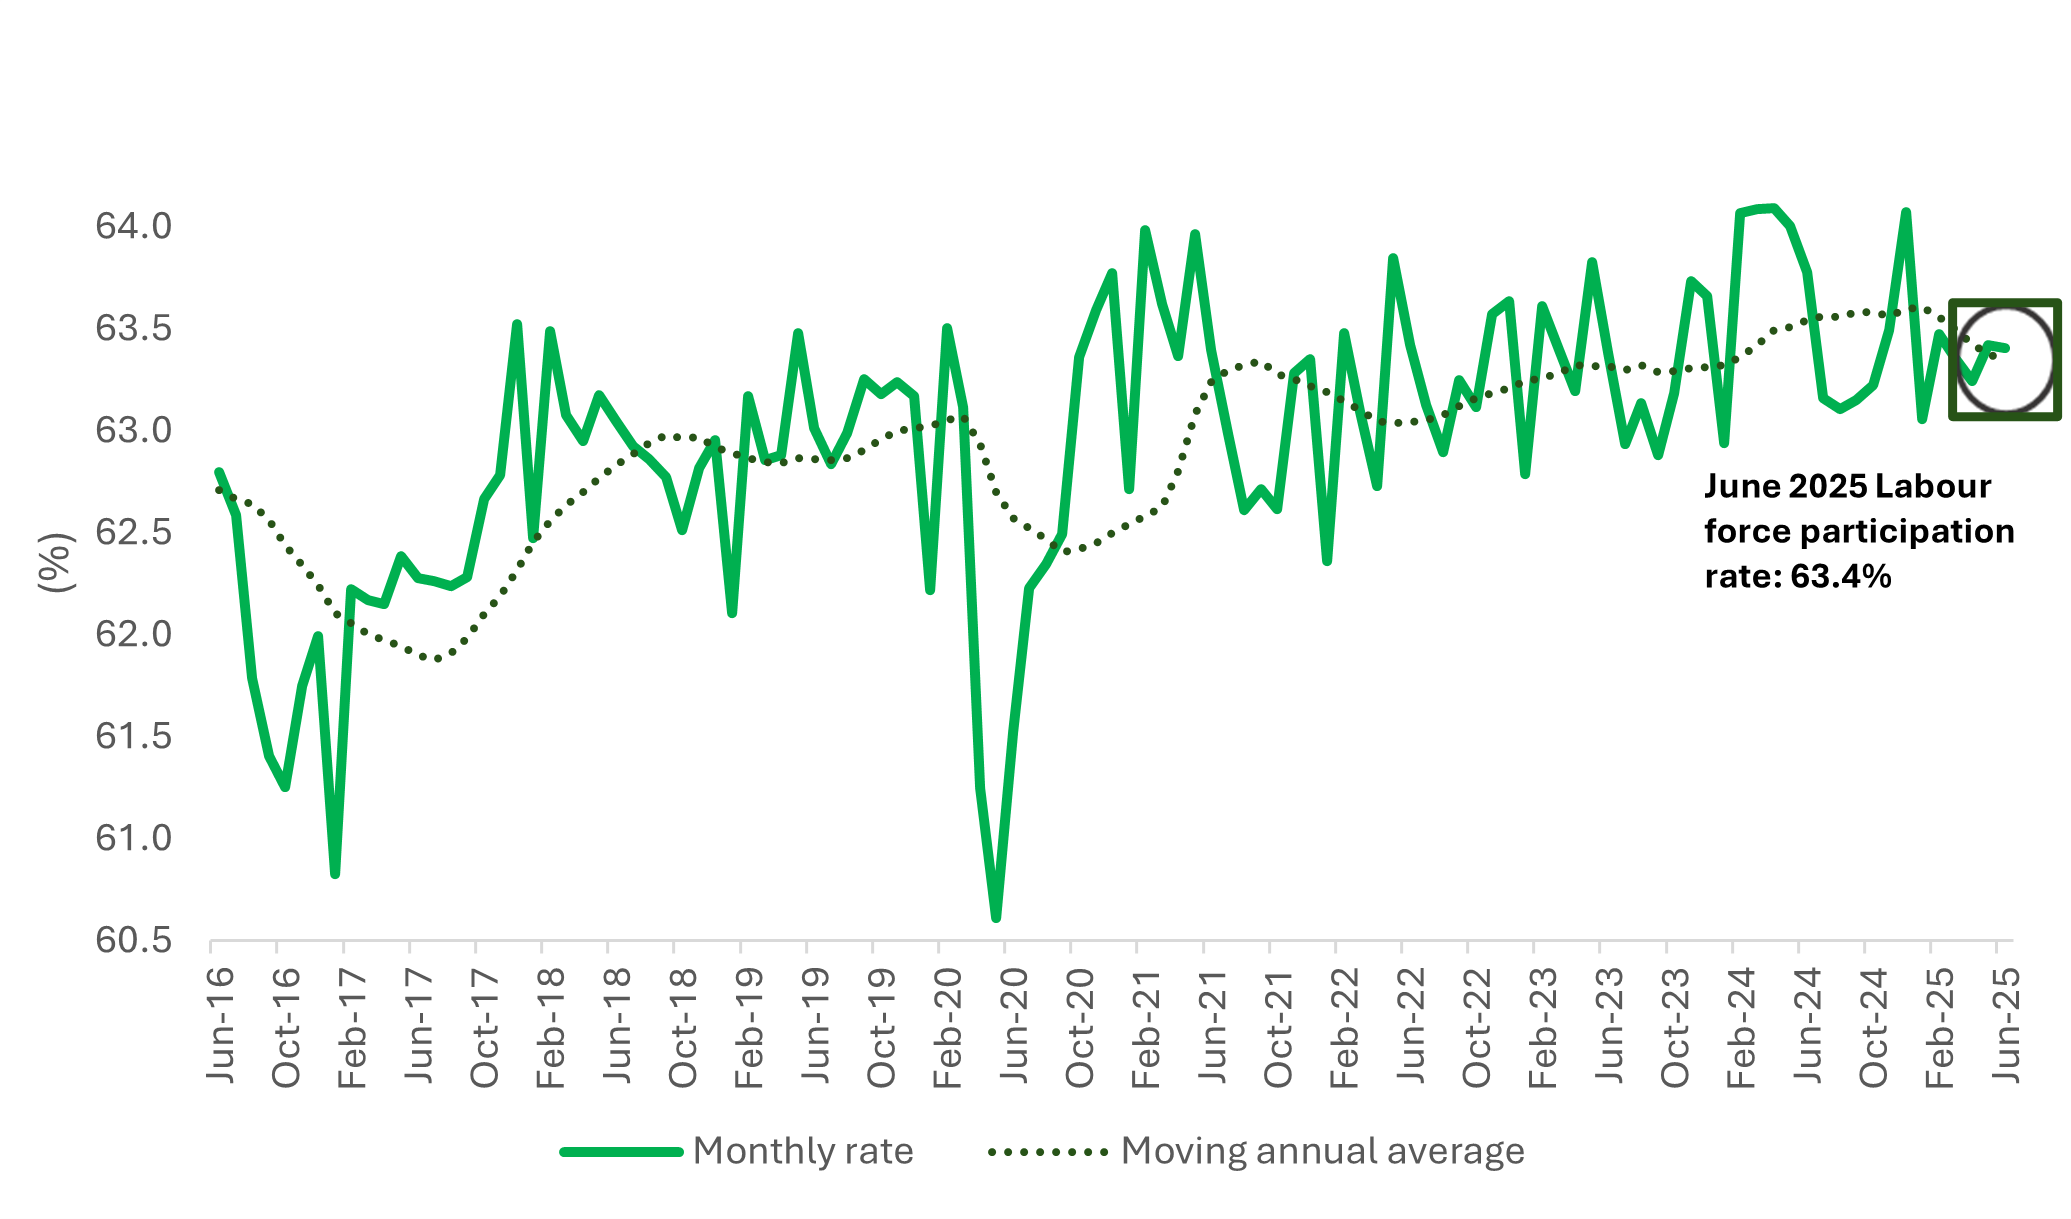
The regional labour force participation rate held steady at 63.4% in June 2025, matching the moving annual average of 63.3%, which smooths out seasonal fluctuations. This sustained participation indicates continued confidence and engagement in regional job markets.

Regional Australia Participation Rate

Source: ABS Labour Force (detailed) RAI
Regional Australia Unemployment Rate 

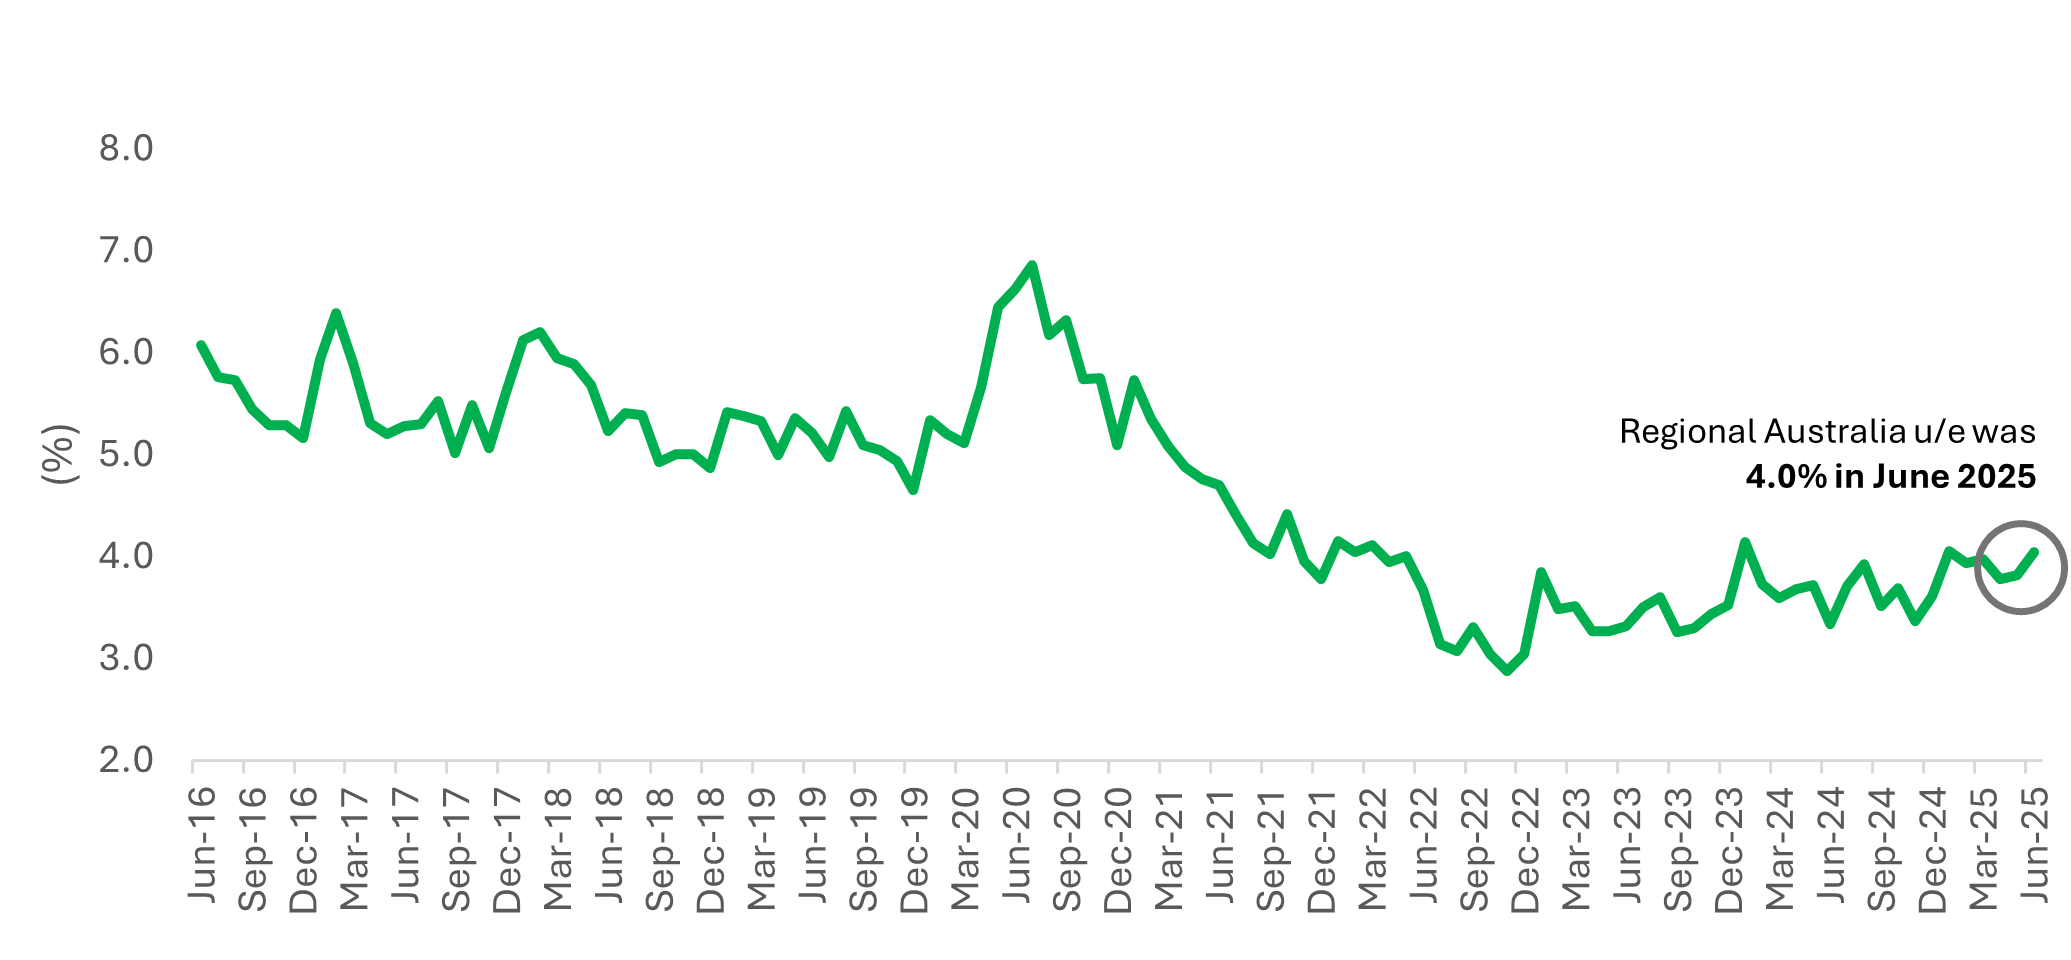
The regional unemployment rate rose to 4.0% in June. The unemployment rate has edged up slightly from the COVID lows of five years ago yet remains well below pre-pandemic levels and remains historically low, underscoring the continuing strength of regional labour conditions. 

Regional Australia Unemployment Rate

Source: ABS Labour Force (detailed) RAI
Streaky Bay, South Australia - Labour Market Case Study

The District Council of Streaky Bay, located on South Australia’s Eyre Peninsula, is home to approximately 2,278 residents. 

Streaky Bay’s major employing industries reflect the region’s agriculture-driven economy. According to the latest data, Agriculture, Forestry and Fishing is the leading sector, accounting for 32.6% of local employment, followed by Retail Trade (12.0%) and Health Care and Social Assistance (10.6%)

As of June 2025, the estimated labour force participation rate in Streaky Bay is 60.1%, closely aligned with the regional SA average of 60.0% but below the national regional participation rate of 63.3%. The local unemployment rate stands at 5.7%, only marginally lower than the regional SA average of 5.8%, suggesting employment opportunities remain limited for local residents. The national regional unemployment rate is 4.0%.

In June 2025, there were an estimated 15 online job advertisements within the Streaky Bay local government area, placing it 36th out of 51 regional SA LGAs. This ranking, however, may not fully reflect true labour demand, as many agricultural roles are often filled through informal networks and not advertised online.

Taken together, these indicators point to a relatively subdued labour market in Streaky Bay which may be attributable to the area’s relatively small population size. In smaller regional communities like Streaky Bay, fewer job ads and lower turnover rates are not necessarily signs of poor labour market health but may simply reflect the demographic profile of the region and the informal nature of local hiring practices.


Note: 

This report integrates data from two key sources: 

  • Job Vacancy Data: Regional job vacancies are sourced from the Internet Vacancy Index (IVI) which is derived from job postings on SEEK, CareerOne and Workforce Australia and provided by Jobs and Skills Australia (JSA). Vacancies are measured using IVI regions
  • Labour Market Indicators: Labour force size, employed population, unemployment rate and participation rate are sourced from the ABS Labour Force (detailed data) and measured using the ABS Greater Capital City Statistical Areas (GCCSAs).

While efforts have been made to align the definition of regional Australia across datasets, differences in geographic boundaries result in minor discrepancies. Users should be aware of these variations when interpreting the data:

  • For IVI data, regional Australia includes all IVI regions except Sydney, Melbourne, Brisbane, Adelaide, and Perth.
  • For ABS labour market indicators, regional Australia is defined as areas outside Greater Sydney, Greater Melbourne, Greater Brisbane, Greater Adelaide and Greater Perth (GCCSAs).

 1) Regional labor market information is also available using the RAI’s interactive online tool, the Regional Jobs Guide 

Appendix

Top 10 Regional Internet Vacancy Index Regions with the Highest Job Vacancies

IVI Region State Job vacancy
Far North Queensland Qld 5,976
Gold Coast Qld 5,920
Canberra & ACT ACT 4,821
Newcastle & Hunter NSW 4,705
Central Queensland Qld 4,008
Bendigo & High Country Vic 3,274
NSW North Coast NSW 3,117
Sunshine Coast Qld 3,099
Toowoomba and South West QLD Qld 2,379
Illawarra & South Coast NSW 2,111


Top 10 Regional Labour Market Regions with the Highest Participation Rates 

Labour Market Region State Rate
Darwin NT 75.00%
Mackay Qld 73.20%
Australian Capital Territory ACT 71.90%
Fitzroy Qld 70.80%
Gold Coast Qld 69.30%
Cairns Qld 69.30%
Western Australia – Outback WA 69.00%
Northern Territory - Outback NT 68.40%
Central West NSW 68.40%
Townsville Qld 68.00%


Top 10 Regional Labour Market Regions with the Lowest Unemployment Rates 

Labour Market Region State Rate
Western Australia – Wheat Belt WA 1.60%
Southern Highlands and Shoalhaven NSW 1.60%
Mackay Qld 1.90%
Warrnambool and South West Vic 2.00%
New England and North West NSW 2.10%
Shepparton Vic 2.20%
Central West NSW 2.50%
Toowoomba Qld 2.60%
Darling Downs – Maranoa Qld 2.60%
Sunshine Coast Qld 2.80%